LaCie Rugged Mini SSD Review: Power-Efficient Flash Storage at 20 Gbps
by Ganesh T S on January 3, 2024 8:00 AM EST- Posted in
- Storage
- SSDs
- Seagate
- Micron
- LaCie
- DAS
- Silicon Motion
- Portable SSDs
Performance Benchmarks
Benchmarks such as ATTO and CrystalDiskMark help provide a quick look at the performance of the direct-attached storage device. The results translate to the instantaneous performance numbers that consumers can expect for specific workloads, but do not account for changes in behavior when the unit is subject to long-term conditioning and/or thermal throttling. Yet another use of these synthetic benchmarks is the ability to gather information regarding support for specific storage device features that affect performance.
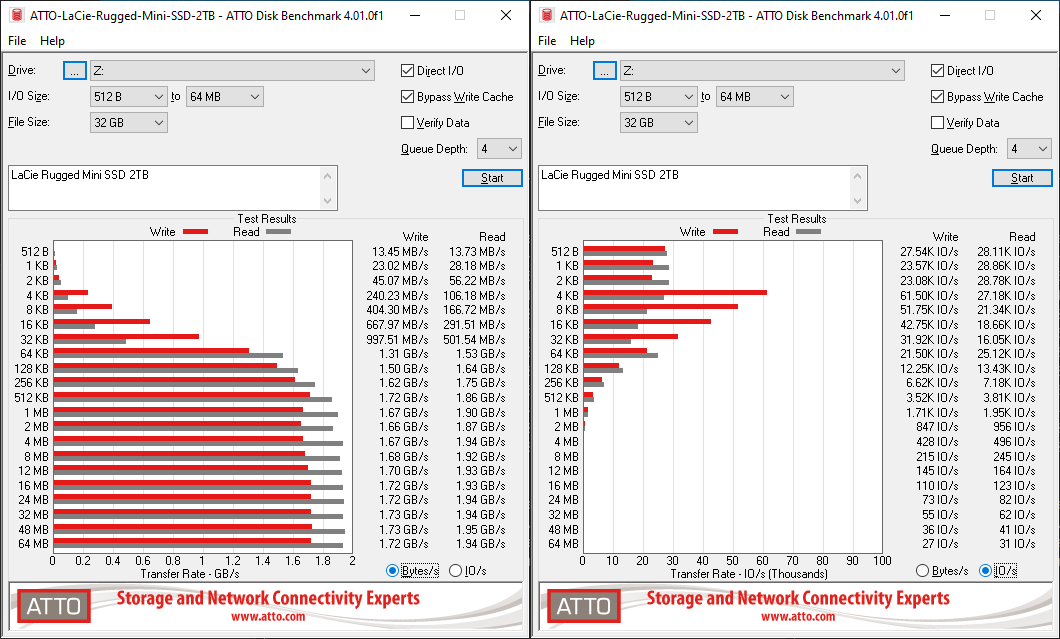
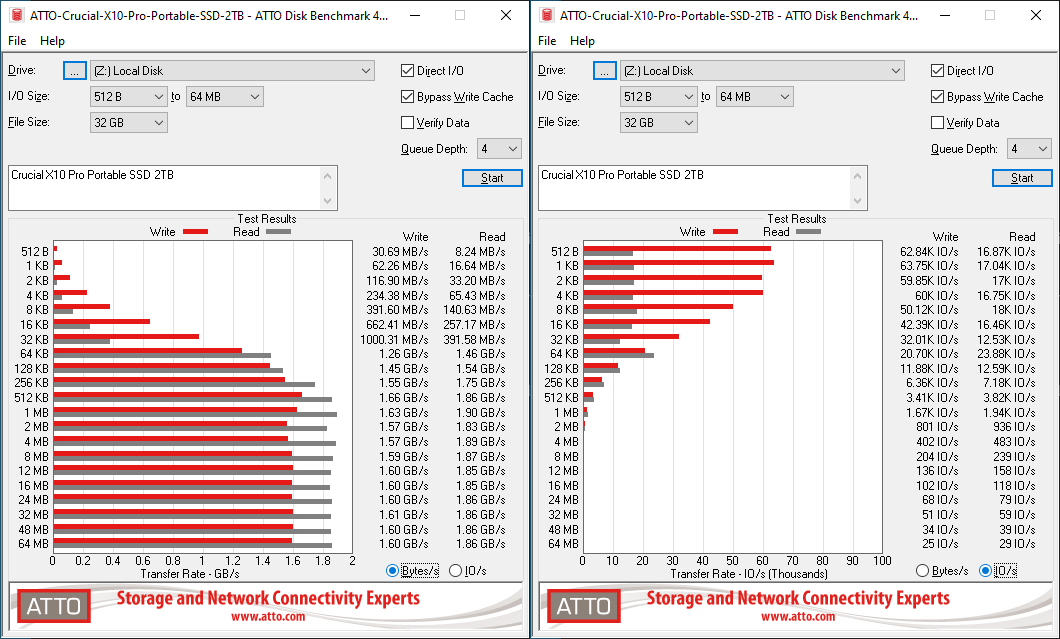
Seagate claims speeds of up to 2000 MBps for the PSSD, and they are reached for reads in the ATTO benchmarks provided below. ATTO benchmarking is restricted to a single configuration in terms of queue depth, and is only representative of a small sub-set of real-world workloads. It does allow the visualization of change in transfer rates as the I/O size changes, with optimal performance being reached around 1 MB for a queue depth of 4.
| ATTO Benchmarks | |
| TOP: | BOTTOM: |
 |
|
 |
|
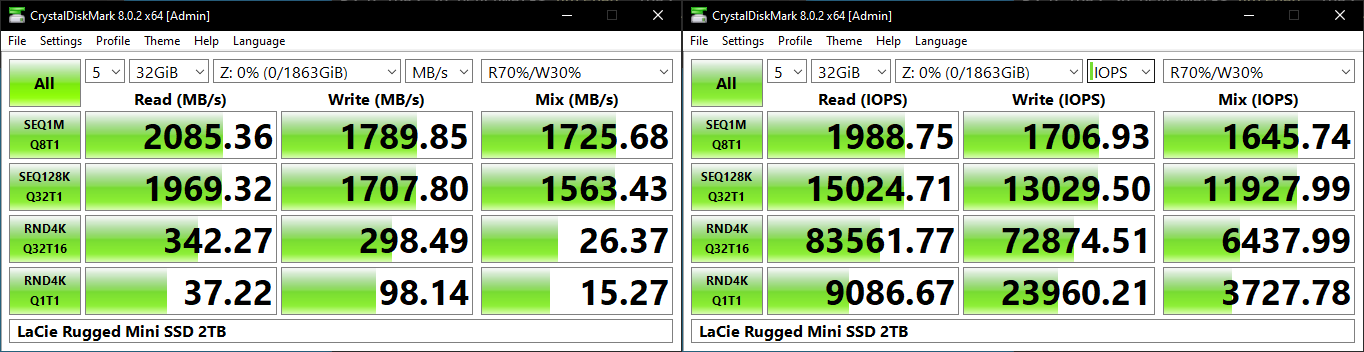
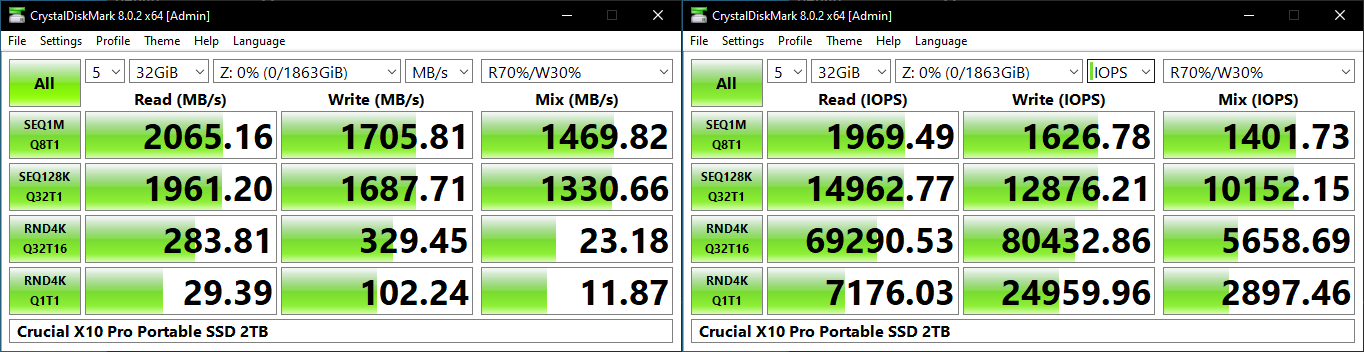
CrystalDiskMark uses four different access traces for reads and writes over a configurable region size. Two of the traces are sequential accesses, while two are 4K random accesses. Internally, CrystalDiskMark uses the Microsoft DiskSpd storage testing tool. The 'Seq128K Q32T1' sequential traces use 128K block size with a queue depth of 32 from a single thread, while the '4K Q32T16' one does random 4K accesses with the same queue configuration, but from multiple threads. The 'Seq1M' traces use a 1MiB block size. The plain 'Rnd4K' one uses only a single queue and single thread . Comparing the '4K Q32T16' and '4K Q1T1' numbers can quickly tell us whether the storage device supports NCQ (native command queuing) / UASP (USB-attached SCSI protocol). If the numbers for the two access traces are in the same ballpark, NCQ / UASP is not supported. This assumes that the host port / drivers on the PC support UASP.
| CrystalDiskMark Benchmarks | |
| TOP: | BOTTOM: |
 |
|
 |
|
UASP and NCQ are supported, allowing the PSSD to deliver true SSD-like performance for random accesses. The sequential numbers and random reads are a notch higher for the Rugged Mini compared to the X10 Pro, but the random writes are slightly worse off. Since the base platform is a DRAM-less NVMe SSD, the random access numbers are not going to be as good as what can be obtained with bridge-based solutions that adopt a SSD with DRAM for the flash translation layer.
AnandTech DAS Suite - Benchmarking for Performance Consistency
Our testing methodology for storage bridges / direct-attached storage units takes into consideration the usual use-case for such devices. The most common usage scenario is transfer of large amounts of photos and videos to and from the unit. Other usage scenarios include the use of the unit as a download or install location for games and importing files directly from it into a multimedia editing program such as Adobe Photoshop. Some users may even opt to boot an OS off an external storage device.
The AnandTech DAS Suite tackles the first use-case. The evaluation involves processing five different workloads:
- AV: Multimedia content with audio and video files totalling 24.03 GB over 1263 files in 109 sub-folders
- Home: Photos and document files totalling 18.86 GB over 7627 files in 382 sub-folders
- BR: Blu-ray folder structure totalling 23.09 GB over 111 files in 10 sub-folders
- ISOs: OS installation files (ISOs) totalling 28.61 GB over 4 files in one folder
- Disk-to-Disk: Addition of 223.32 GB spread over 171 files in 29 sub-folders to the above four workloads (total of 317.91 GB over 9176 files in 535 sub-folders)
Except for the 'Disk-to-Disk' workload, each data set is first placed in a 29GB RAM drive, and a robocopy command is issue to transfer it to the external storage unit (formatted in exFAT for flash-based units, and NTFS for HDD-based units).
robocopy /NP /MIR /NFL /J /NDL /MT:32 $SRC_PATH $DEST_PATH
Upon completion of the transfer (write test), the contents from the unit are read back into the RAM drive (read test) after a 10 second idling interval. This process is repeated three times for each workload. Read and write speeds, as well as the time taken to complete each pass are recorded. Whenever possible, the temperature of the external storage device is recorded during the idling intervals. Bandwidth for each data set is computed as the average of all three passes.
The 'Disk-to-Disk' workload involves a similar process, but with one iteration only. The data is copied to the external unit from the CPU-attached NVMe drive, and then copied back to the internal drive. It does include more amount of continuous data transfer in a single direction, as data that doesn't fit in the RAM drive is also part of the workload set.
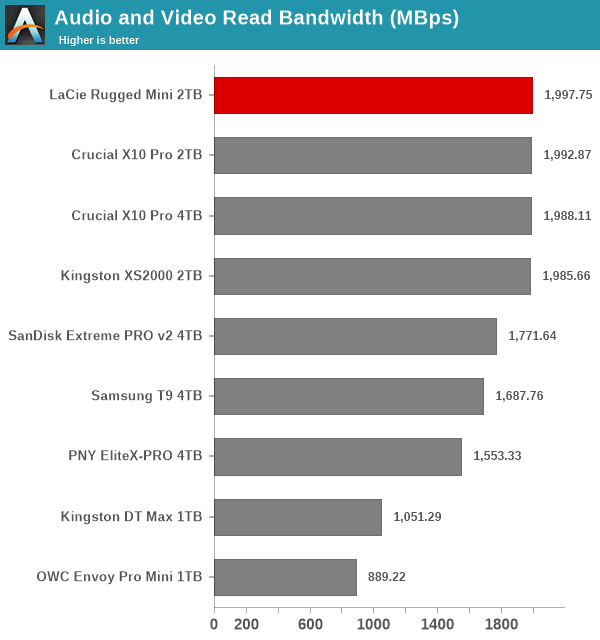
The Rugged Mini SSD is perfectly configured for read-heavy workloads, being in the top two or approaching the numbers at the top in almost all segments. The writes are held back a bit compared to the drives using a DRAM-equipped internal SSD, but the Rugged Mini manages to stay in the middle of the pack. In addition to these numbers, power users may want to dig deeper to understand the limits of each device. To address this concern, we also instrumented our evaluation scheme for determining performance consistency.
Performance Consistency
Aspects influencing the performance consistency include SLC caching and thermal throttling / firmware caps on access rates to avoid overheating. This is important for power users, as the last thing that they want to see when copying over 100s of GB of data is the transfer rate going down to USB 2.0 speeds.
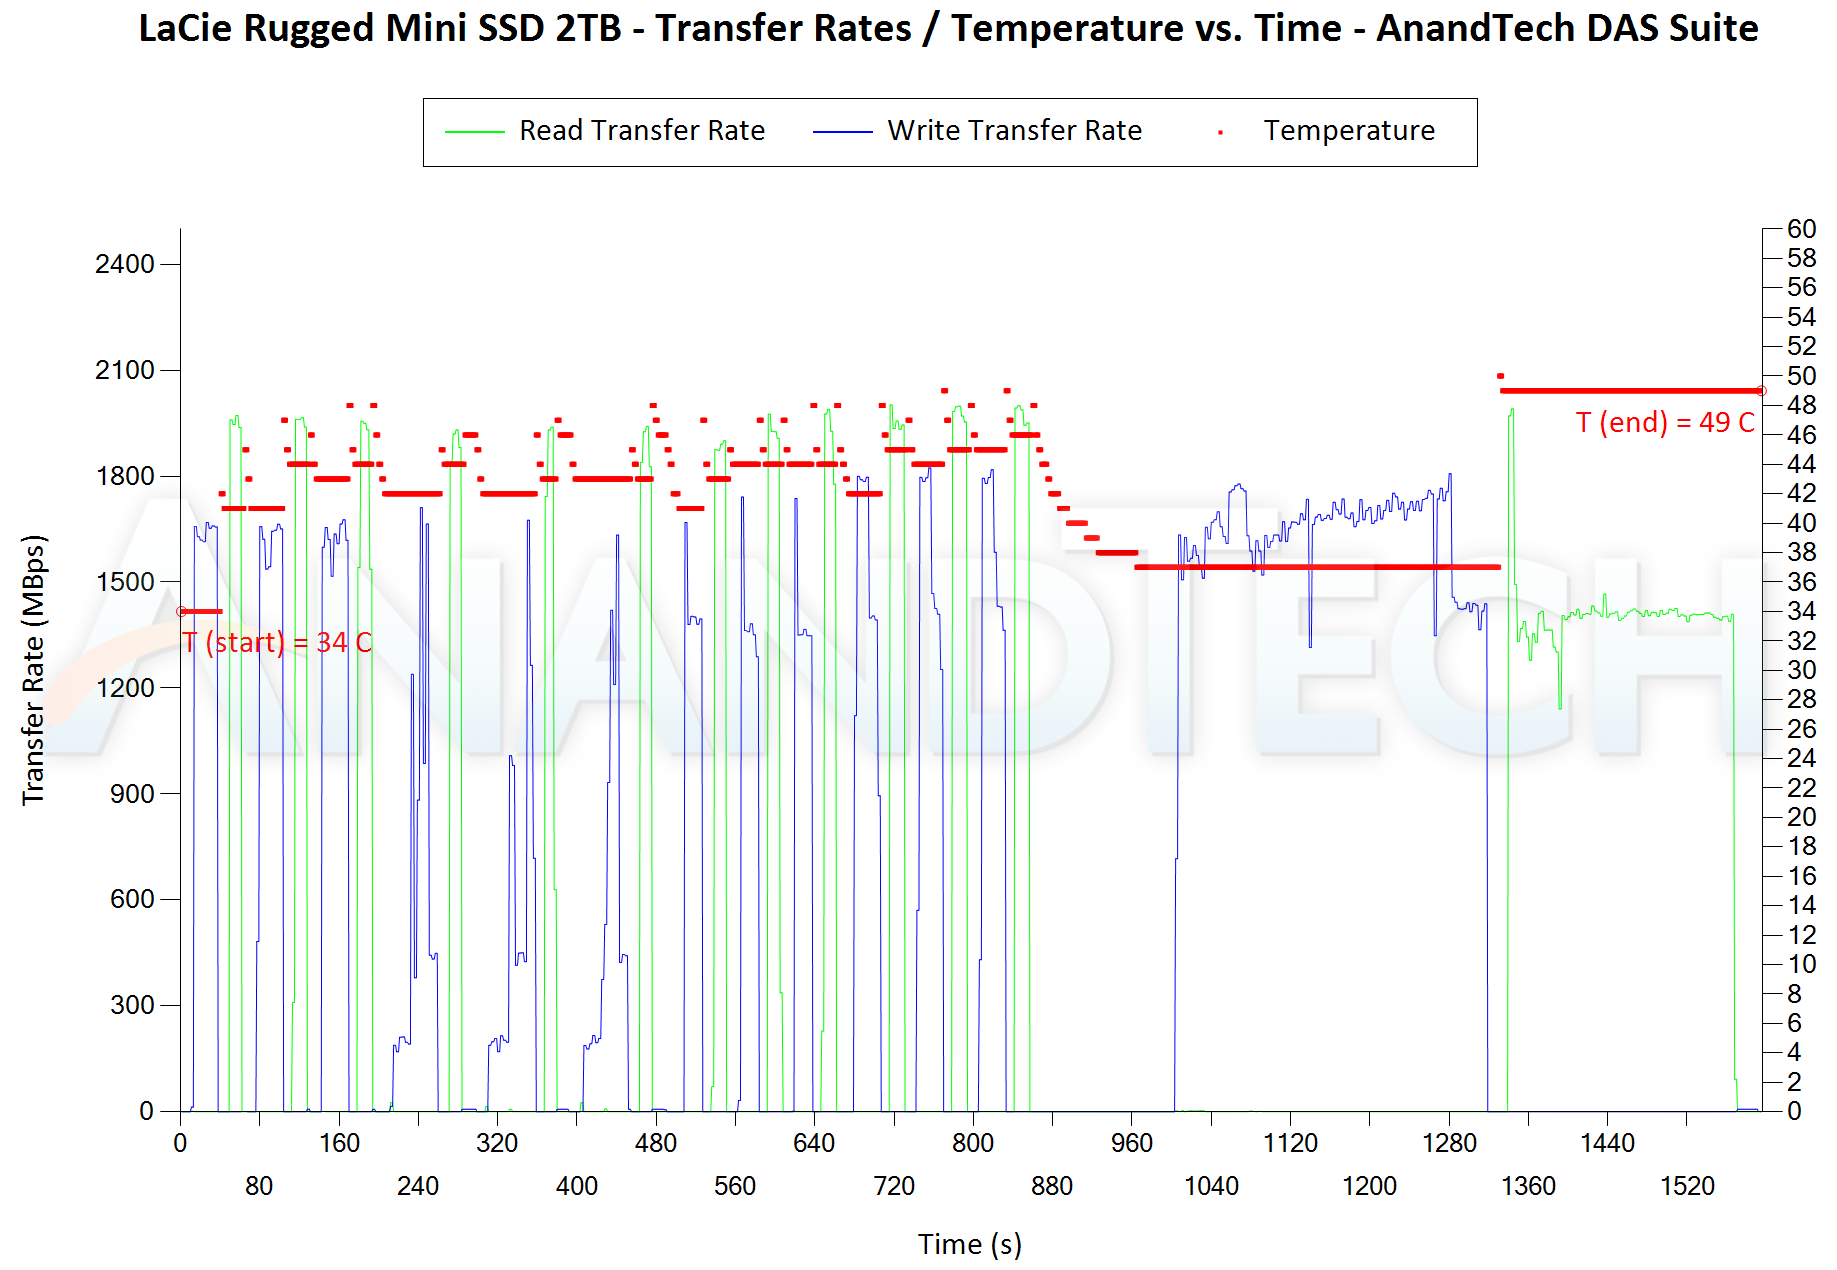
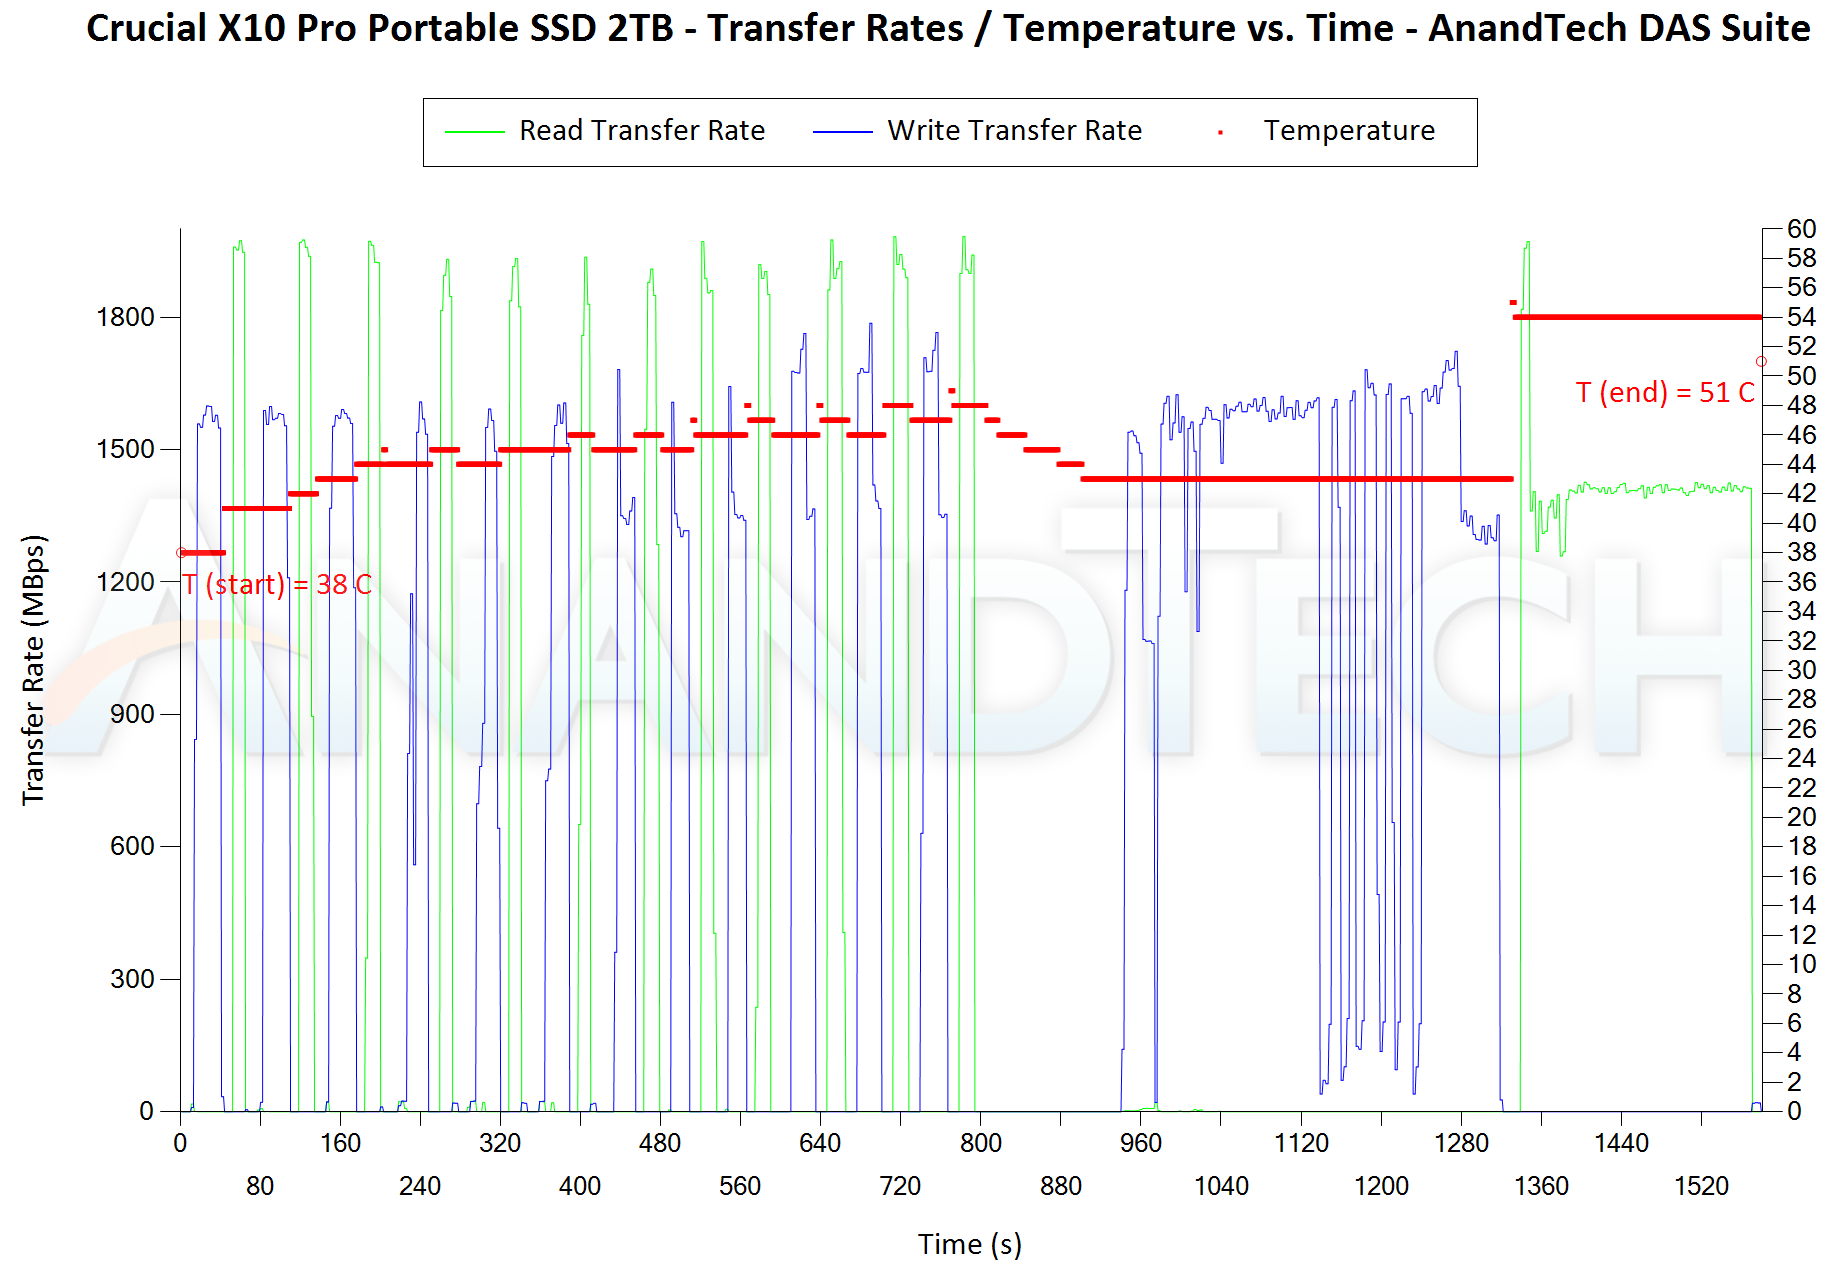
In addition to tracking the instantaneous read and write speeds of the DAS when processing the AnandTech DAS Suite, the temperature of the drive was also recorded. In earlier reviews, we used to track the temperature all through. However, we have observed that SMART read-outs for the temperature in NVMe SSDs using USB 3.2 Gen 2 bridge chips end up negatively affecting the actual transfer rates. To avoid this problem, we have restricted ourselves to recording the temperature only during the idling intervals. The graphs below present the recorded data.
| AnandTech DAS Suite - Performance Consistency | |
| TOP: | BOTTOM: |
 |
|
 |
|
The first three sets of writes and reads correspond to the AV suite. A small gap (for the transfer of the video suite from the internal SSD to the RAM drive) is followed by three sets for the Home suite. Another small RAM-drive transfer gap is followed by three sets for the Blu-ray folder. This is followed up with the large-sized ISO files set. Finally, we have the single disk-to-disk transfer set.
The Rugged Mini has excellent performance consistency, but its performance profile is markedly different from the Crucial X10 Pro when handling small files. In the 'Home' suite, we see the PSSD start off a bit slow in all three iterations with the small files. The X10 Pro, on the other hand, manages to provide much faster performance for the same. However, the Rugged Mini is able to absorb the later sequential writes in the disk-to-disk segment with barely a hiccup, probably thanks to the background folding of the data from the SLC to the TLC segment. The X10 Pro has drops down to 100 MBps in that scenario. The thermal solution is also more effective in the Rugged Mini SSD, but it must be kept in mind that the drive is physically larger than the X10 Pro.
PCMark 10 Storage Bench - Real-World Access Traces
There are a number of storage benchmarks that can subject a device to artificial access traces by varying the mix of reads and writes, the access block sizes, and the queue depth / number of outstanding data requests. We saw results from two popular ones - ATTO, and CrystalDiskMark - earlier in this section. More serious benchmarks, however, actually replicate access traces from real-world workloads to determine the suitability of a particular device for a particular workload. Real-world access traces may be used for simulating the behavior of computing activities that are limited by storage performance. Examples include booting an operating system or loading a particular game from the disk.
PCMark 10's storage bench (introduced in v2.1.2153) includes four storage benchmarks that use relevant real-world traces from popular applications and common tasks to fully test the performance of the latest modern drives:
- The Full System Drive Benchmark uses a wide-ranging set of real-world traces from popular applications and common tasks to fully test the performance of the fastest modern drives. It involves a total of 204 GB of write traffic.
- The Quick System Drive Benchmark is a shorter test with a smaller set of less demanding real-world traces. It subjects the device to 23 GB of writes.
- The Data Drive Benchmark is designed to test drives that are used for storing files rather than applications. These typically include NAS drives, USB sticks, memory cards, and other external storage devices. The device is subjected to 15 GB of writes.
- The Drive Performance Consistency Test is a long-running and extremely demanding test with a heavy, continuous load for expert users. In-depth reporting shows how the performance of the drive varies under different conditions. This writes more than 23 TB of data to the drive.
Despite the data drive benchmark appearing most suitable for testing direct-attached storage, we opt to run the full system drive benchmark as part of our evaluation flow. Many of us use portable flash drives as boot drives and storage for Steam games. These types of use-cases are addressed only in the full system drive benchmark.
The Full System Drive Benchmark comprises of 23 different traces. For the purpose of presenting results, we classify them under five different categories:
- Boot: Replay of storage access trace recorded while booting Windows 10
- Creative: Replay of storage access traces recorded during the start up and usage of Adobe applications such as Acrobat, After Effects, Illustrator, Premiere Pro, Lightroom, and Photoshop.
- Office: Replay of storage access traces recorded during the usage of Microsoft Office applications such as Excel and Powerpoint.
- Gaming: Replay of storage access traces recorded during the start up of games such as Battlefield V, Call of Duty Black Ops 4, and Overwatch.
- File Transfers: Replay of storage access traces (Write-Only, Read-Write, and Read-Only) recorded during the transfer of data such as ISOs and photographs.
PCMark 10 also generates an overall score, bandwidth, and average latency number for quick comparison of different drives. The sub-sections in the rest of the page reference the access traces specified in the PCMark 10 Technical Guide.
Booting Windows 10
The read-write bandwidth recorded for each drive in the boo access trace (that is the tag given in the official PCMark technical guide) is presented below.
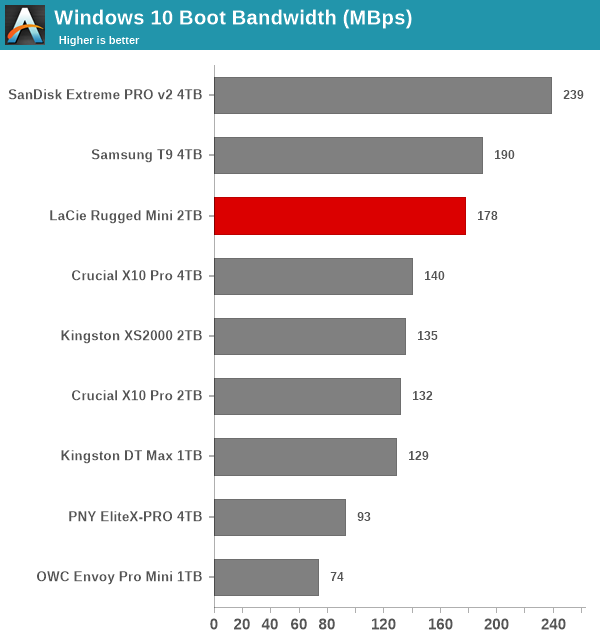
The mixture of access traces triggered by this workload is well serviced by dedicated NVMe SSD controllers - so we see the PSSDs based on native flash controllers ranked behind the bridge-based solutions. The Rugged Mini puts up a creditable show by providing leading performance among the native UFD-controller-based solutions.
Creative Workloads
The read-write bandwidth recorded for each drive in the sacr, saft, sill, spre, slig, sps, aft, exc, ill, ind, psh, and psl access traces are presented below.
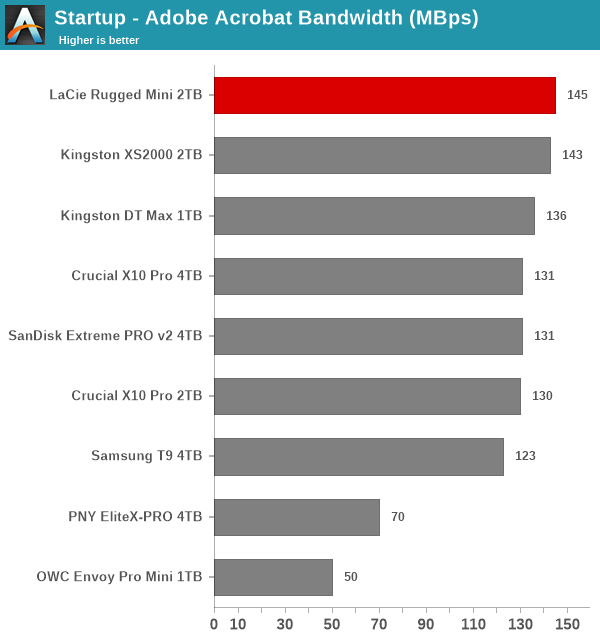
The Rugged Mini turns in impressive performance across all creative workload segments except for the heavy Photoshop usage scenario. Other than that, it manages to be in the top three, or have numbers close to the ones in the top positions.
Office Workloads
The read-write bandwidth recorded for each drive in the exc and pow access traces are presented below.
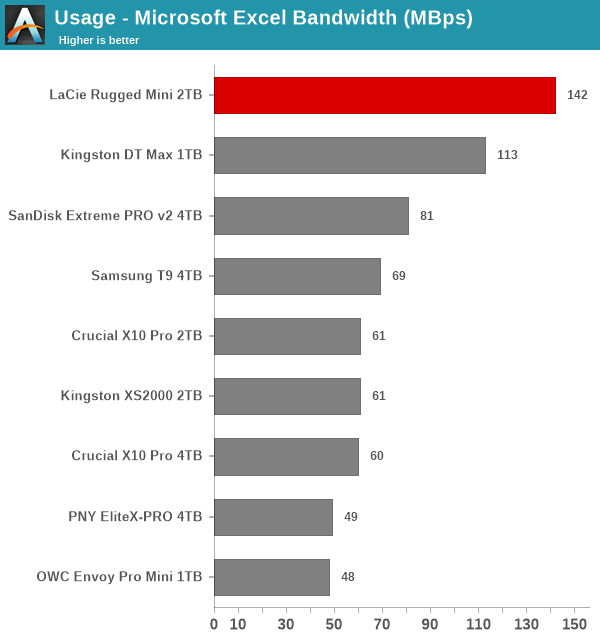
Handling spreadsheets in the Rugged Mini is much better than handling presentations, but these types of PSSDs are not tuned for that purpose.
Gaming Workloads
The read-write bandwidth recorded for each drive in the bf, cod, and ow access traces are presented below.
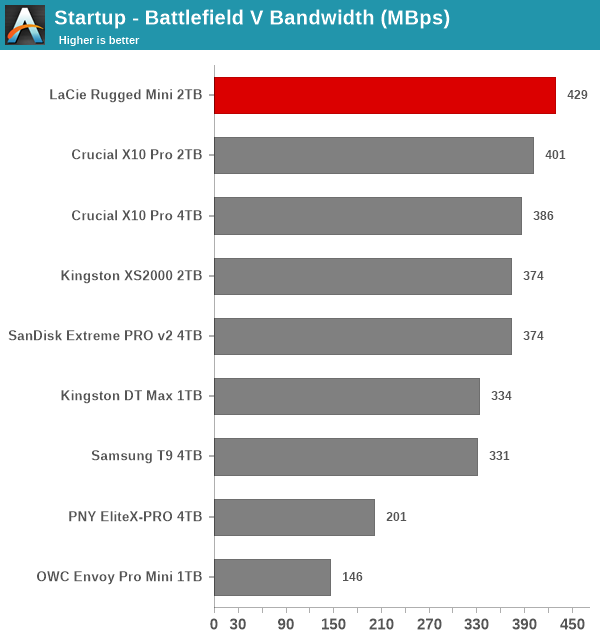
Gaming workloads are usually read-heavy, and the Rugged Mini has no problems in turning up as the top performer in two of the three workloads. Loading a large number of small-sized assets can trip up the performance slightly, as we see in the Call of Duty workload.
Files Transfer Workloads
The read-write bandwidth recorded for each drive in the cp1, cp2, cp3, cps1, cps2, and cps3 access traces are presented below.
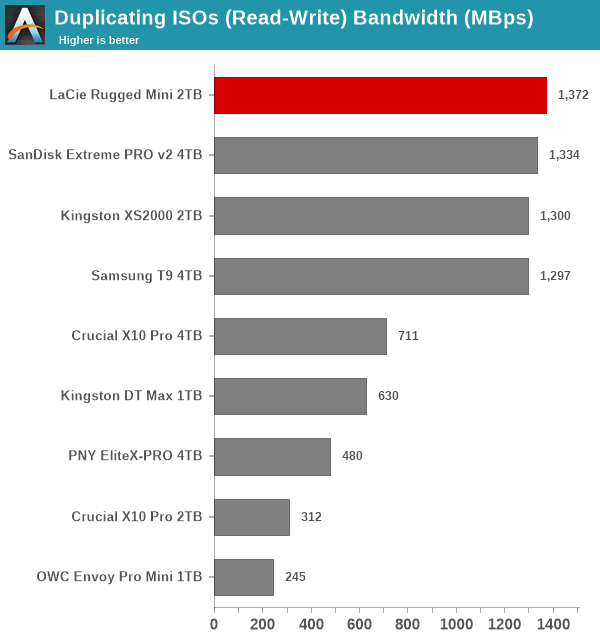
These numbers largely reflect the trend seen in the AnandTech DAS Suite graphs, and only the SanDisk Extreme PRO v2 at double the capacity is able to deliver a better overall performance. Among native UFD controller solutions, the Rugged Mini is at the top.
Overall Scores
PCMark 10 reports an overall score based on the observed bandwidth and access times for the full workload set. The score, bandwidth, and average access latency for each of the drives are presented below.
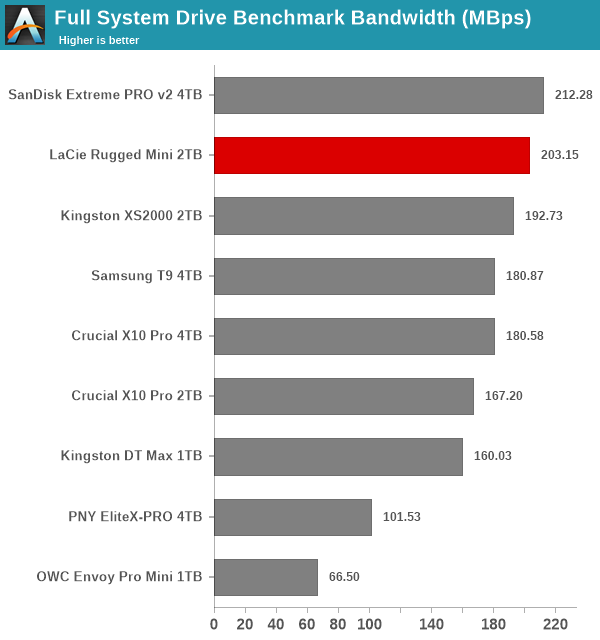
The LaCie Rugged Mini SSD makes its mark as the top performer in the overall PCMark 10 Storage Bench scores among all units with native UFD controllers. Only the bridge-based SanDisk Extreme PRO v2 is able to deliver better numbers with its DRAM-based SSD.


8 Comments
View All Comments
VinceVDC - Wednesday, January 3, 2024 - link
I bought my first LaCie drive in 1987. It was a 100mb SCSI drive and cost $1100. The thing still works but is pretty much useless due to its size.ballsystemlord - Wednesday, January 3, 2024 - link
Can you upload a picture and post a link here? That'd be cool to see!VinceVDC - Friday, January 5, 2024 - link
It was part of my "this is what computers used to look like" display when I had lots of room at home.Let me see if I can find it after the move (downsized).. Sooo many boxes, lol
The Mac SE it was attached to failed the smoke test a couple years ago.
Picture a 5-1/4 inch external CD drive with a 25 pin SCSI connector.
I bought it in 1987 from the LaCie office in Tigard, OR.
Da Kat - Thursday, January 4, 2024 - link
As big as a Kia, I'd bet..Mehere88 - Tuesday, January 9, 2024 - link
Why tout a 20Gbps connection for a device that can't go past 2.8 Gbps?mikato - Friday, January 19, 2024 - link
Why have an orange bumper around it for a device that isn't sensitive to physical shock damage?Chrestos SV1GAP - Thursday, February 8, 2024 - link
There is a (minor) error:"Review Link Crucial X10 Pro 2TB Review Crucial X10 Pro 2TB Review"
J.in.Tech - Friday, February 16, 2024 - link
As someone who has purchased Lacie drives on and off over the years, and literally all of them failing, I am weary of the brand regardless of them now being owned by Seagate.