Crucial X9 Pro Portable SSD Review: Micron 176L 3D NAND Delivers Record UFD Consistency
by Ganesh T S on August 18, 2023 8:00 AM EST- Posted in
- Storage
- Crucial
- Micron
- DAS
- Silicon Motion
- Type-C
- USB
- Portable SSDs
Performance Benchmarks
Benchmarks such as ATTO and CrystalDiskMark help provide a quick look at the performance of the direct-attached storage device. The results translate to the instantaneous performance numbers that consumers can expect for specific workloads, but do not account for changes in behavior when the unit is subject to long-term conditioning and/or thermal throttling. Yet another use of these synthetic benchmarks is the ability to gather information regarding support for specific storage device features that affect performance.
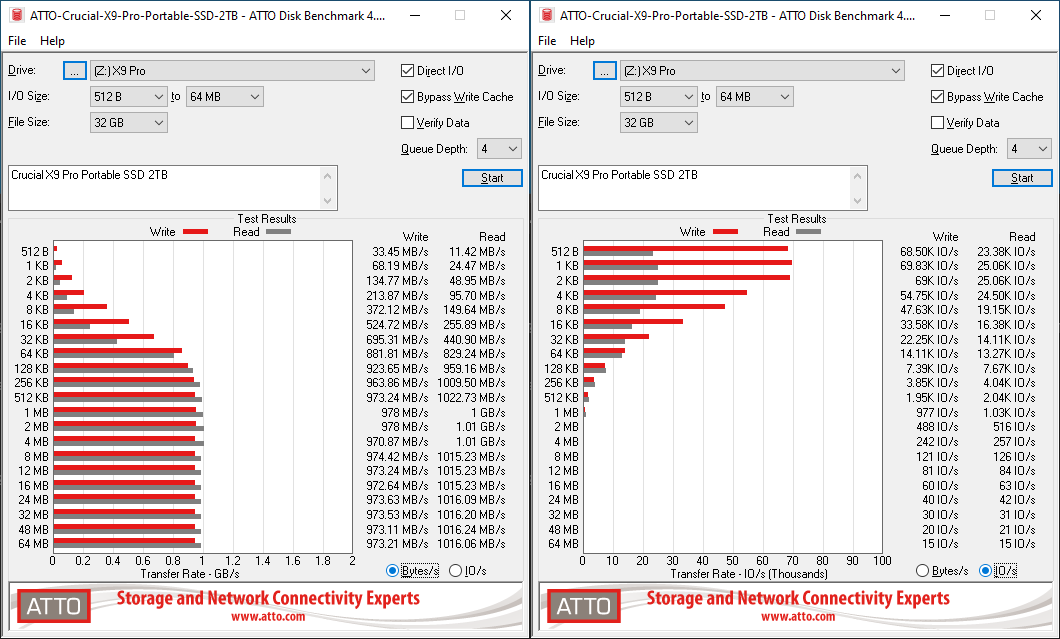
Crucial claims read and write speeds of up to 1050 MBps. The numbers obtained in the ATTO benchmarks below reach very close to that number. ATTO benchmarking is restricted to a single configuration in terms of queue depth, and is only representative of a small sub-set of real-world workloads. It is likely that Crucial's quoted numbers are for a different queue depth. ATTO does allow the visualization of change in transfer rates as the I/O size changes, with optimal performance being reached around 2048 KB for a queue depth of 4. Any transfer size upwards of 128 KB is enough to give the impression of a saturated interface for mainstream users, though.
| ATTO Benchmarks | |
| TOP: | BOTTOM: |
 |
|
 |
|
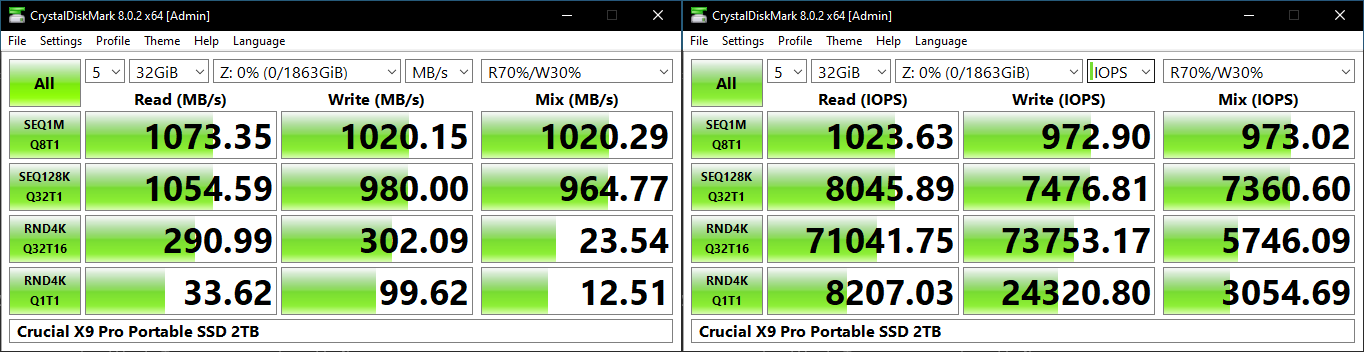
CrystalDiskMark uses four different access traces for reads and writes over a configurable region size. Two of the traces are sequential accesses, while two are 4K random accesses. Internally, CrystalDiskMark uses the Microsoft DiskSpd storage testing tool. The 'Seq128K Q32T1' sequential traces use 128K block size with a queue depth of 32 from a single thread, while the '4K Q32T16' one does random 4K accesses with the same queue configuration, but from multiple threads. The 'Seq1M' traces use a 1MiB block size. The plain 'Rnd4K' one uses only a single queue and single thread . Comparing the '4K Q32T16' and '4K Q1T1' numbers can quickly tell us whether the storage device supports NCQ (native command queuing) / UASP (USB-attached SCSI protocol). If the numbers for the two access traces are in the same ballpark, NCQ / UASP is not supported. This assumes that the host port / drivers on the PC support UASP.
| CrystalDiskMark Benchmarks | |
| TOP: | BOTTOM: |
 |
|
 |
|
Sequential reads surpass Crucial's claims at a queue depth of 8, while sequential writes reach 1020 MBps. On the random access front, we see a marked increase in IOPS when moving from a queue depth of 1 to 32, indicating that NCQ is active and working well.
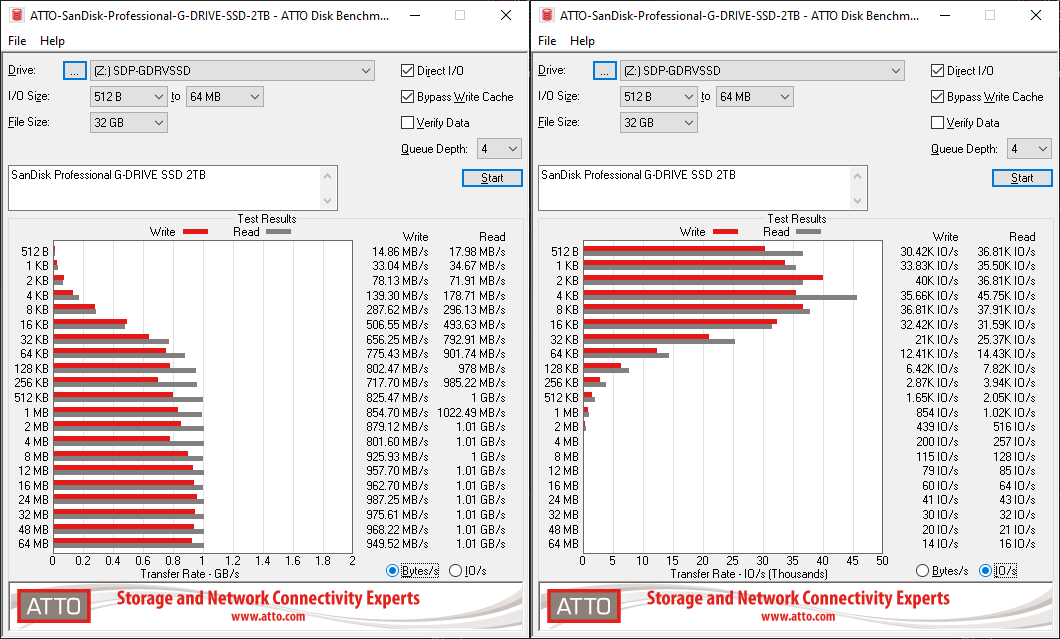
Competitive analysis will be dealt with in subsequent sections, but it makes sense to point out that the sequential numbers are not markedly different for the considered PSSDs. However, the SanDisk PSSDs employ a bridge-based solution. The PRO G40 uses a DRAM-equipped internal SSD, and the G-DRIVE includes a volatile write cache. These aspects combine to give the SanDisk PSSDs a distinct advantage in the high queue-depth random access traces. The Samsung T7 Shield also employs a bridge-based solution, albeit with a DRAM-less SSD platform. The high queue-depth random reads are better in the T7 Shield, but that platform / firmware doesn't seem to be optimized for writes with similar characteristics, and comes in with less than half the IOPS of the Crucial X9 Pro.
AnandTech DAS Suite - Benchmarking for Performance Consistency
Our testing methodology for storage bridges / direct-attached storage units takes into consideration the usual use-case for such devices. The most common usage scenario is transfer of large amounts of photos and videos to and from the unit. Other usage scenarios include the use of the unit as a download or install location for games and importing files directly from it into a multimedia editing program such as Adobe Photoshop. Some users may even opt to boot an OS off an external storage device.
The AnandTech DAS Suite tackles the first use-case. The evaluation involves processing five different workloads:
- AV: Multimedia content with audio and video files totalling 24.03 GB over 1263 files in 109 sub-folders
- Home: Photos and document files totalling 18.86 GB over 7627 files in 382 sub-folders
- BR: Blu-ray folder structure totalling 23.09 GB over 111 files in 10 sub-folders
- ISOs: OS installation files (ISOs) totalling 28.61 GB over 4 files in one folder
- Disk-to-Disk: Addition of 223.32 GB spread over 171 files in 29 sub-folders to the above four workloads (total of 317.91 GB over 9176 files in 535 sub-folders)
Except for the 'Disk-to-Disk' workload, each data set is first placed in a 29GB RAM drive, and a robocopy command is issue to transfer it to the external storage unit (formatted in exFAT for flash-based units, and NTFS for HDD-based units).
robocopy /NP /MIR /NFL /J /NDL /MT:32 $SRC_PATH $DEST_PATH
Upon completion of the transfer (write test), the contents from the unit are read back into the RAM drive (read test) after a 10 second idling interval. This process is repeated three times for each workload. Read and write speeds, as well as the time taken to complete each pass are recorded. Whenever possible, the temperature of the external storage device is recorded during the idling intervals. Bandwidth for each data set is computed as the average of all three passes.
The 'Disk-to-Disk' workload involves a similar process, but with one iteration only. The data is copied to the external unit from the CPU-attached NVMe drive, and then copied back to the internal drive. It does include more amount of continuous data transfer in a single direction, as data that doesn't fit in the RAM drive is also part of the workload set.
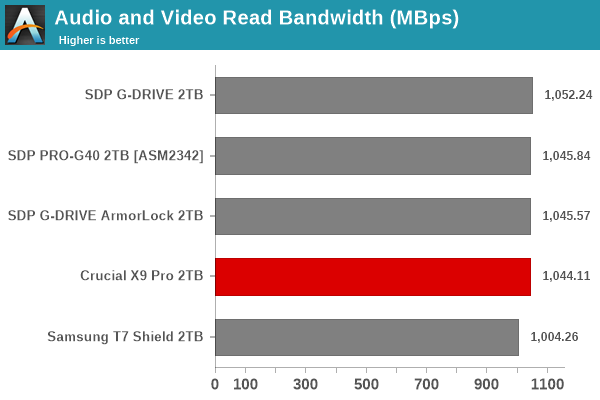
Read transfers have no issues in saturating the interface - particularly for large file sizes. For smaller file sizes, there is no significant gulf in the numbers between the different units. For all practical purposes, the casual user will notice no difference between them in the course of normal usage. For writes, large-sized files have very good performance matching other high-end bridge-based PSSDs. However, putting in a mixture of file sizes at high queue depths results in dips in performance that is only to be expected from a DRAM-less configuration (as evident from the corresponding numbers for bridge based PSSDs that employ an internal SSD with DRAM for housekeeping). Power users may also want to dig deeper to understand the limits of the device. To address this concern, we also instrumented our evaluation scheme for determining performance consistency.
Performance Consistency
Aspects influencing the performance consistency include SLC caching and thermal throttling / firmware caps on access rates to avoid overheating. This is important for power users, as the last thing that they want to see when copying over 100s of GB of data is the transfer rate going down to USB 2.0 speeds.
In addition to tracking the instantaneous read and write speeds of the DAS when processing the AnandTech DAS Suite, the temperature of the drive was also recorded. In earlier reviews, we used to track the temperature all through. However, we have observed that SMART read-outs for the temperature in NVMe SSDs using USB 3.2 Gen 2 bridge chips end up negatively affecting the actual transfer rates. To avoid this problem, we have restricted ourselves to recording the temperature only during the idling intervals. The graphs below present the recorded data.
| AnandTech DAS Suite - Performance Consistency | |
| TOP: | BOTTOM: |
 |
|
 |
|
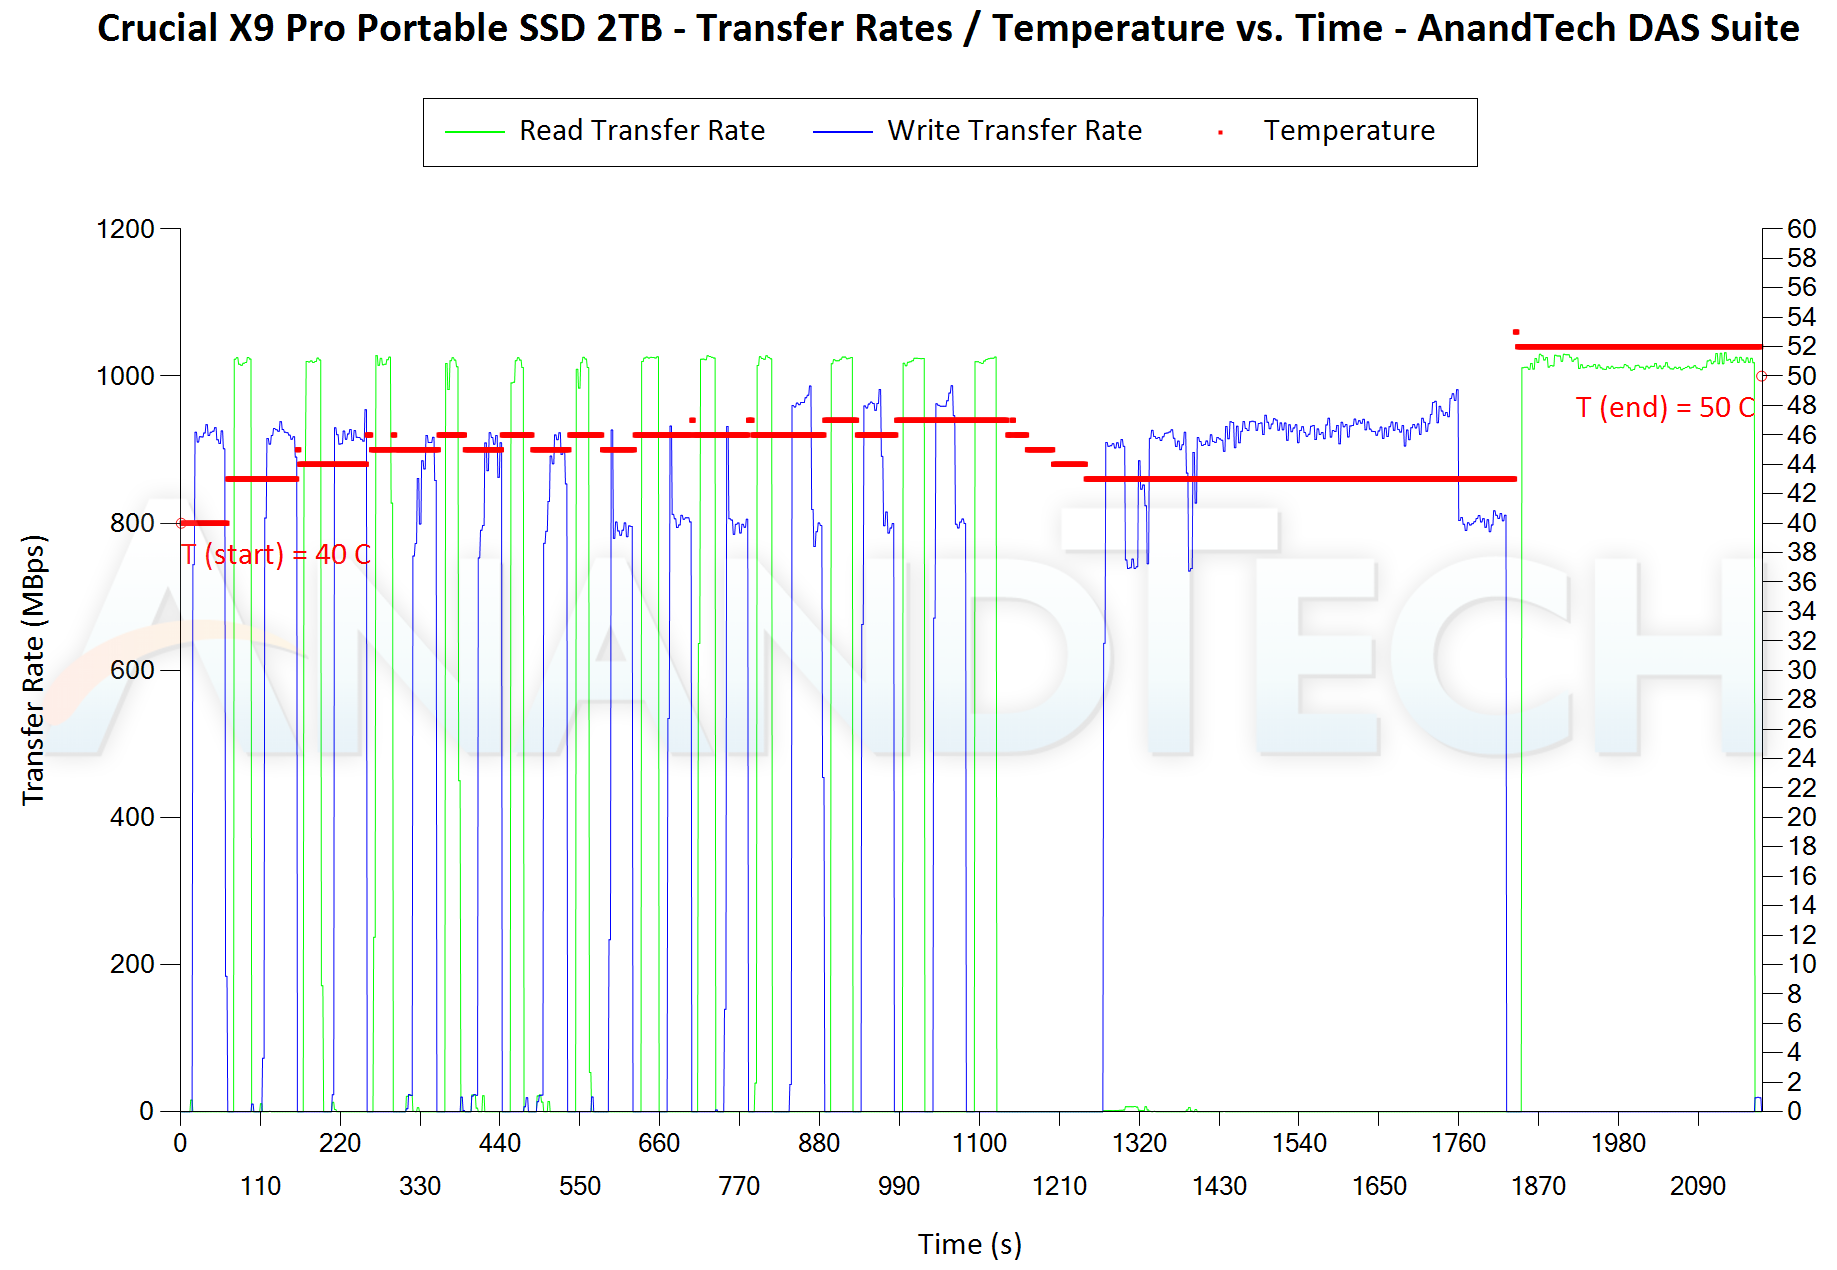
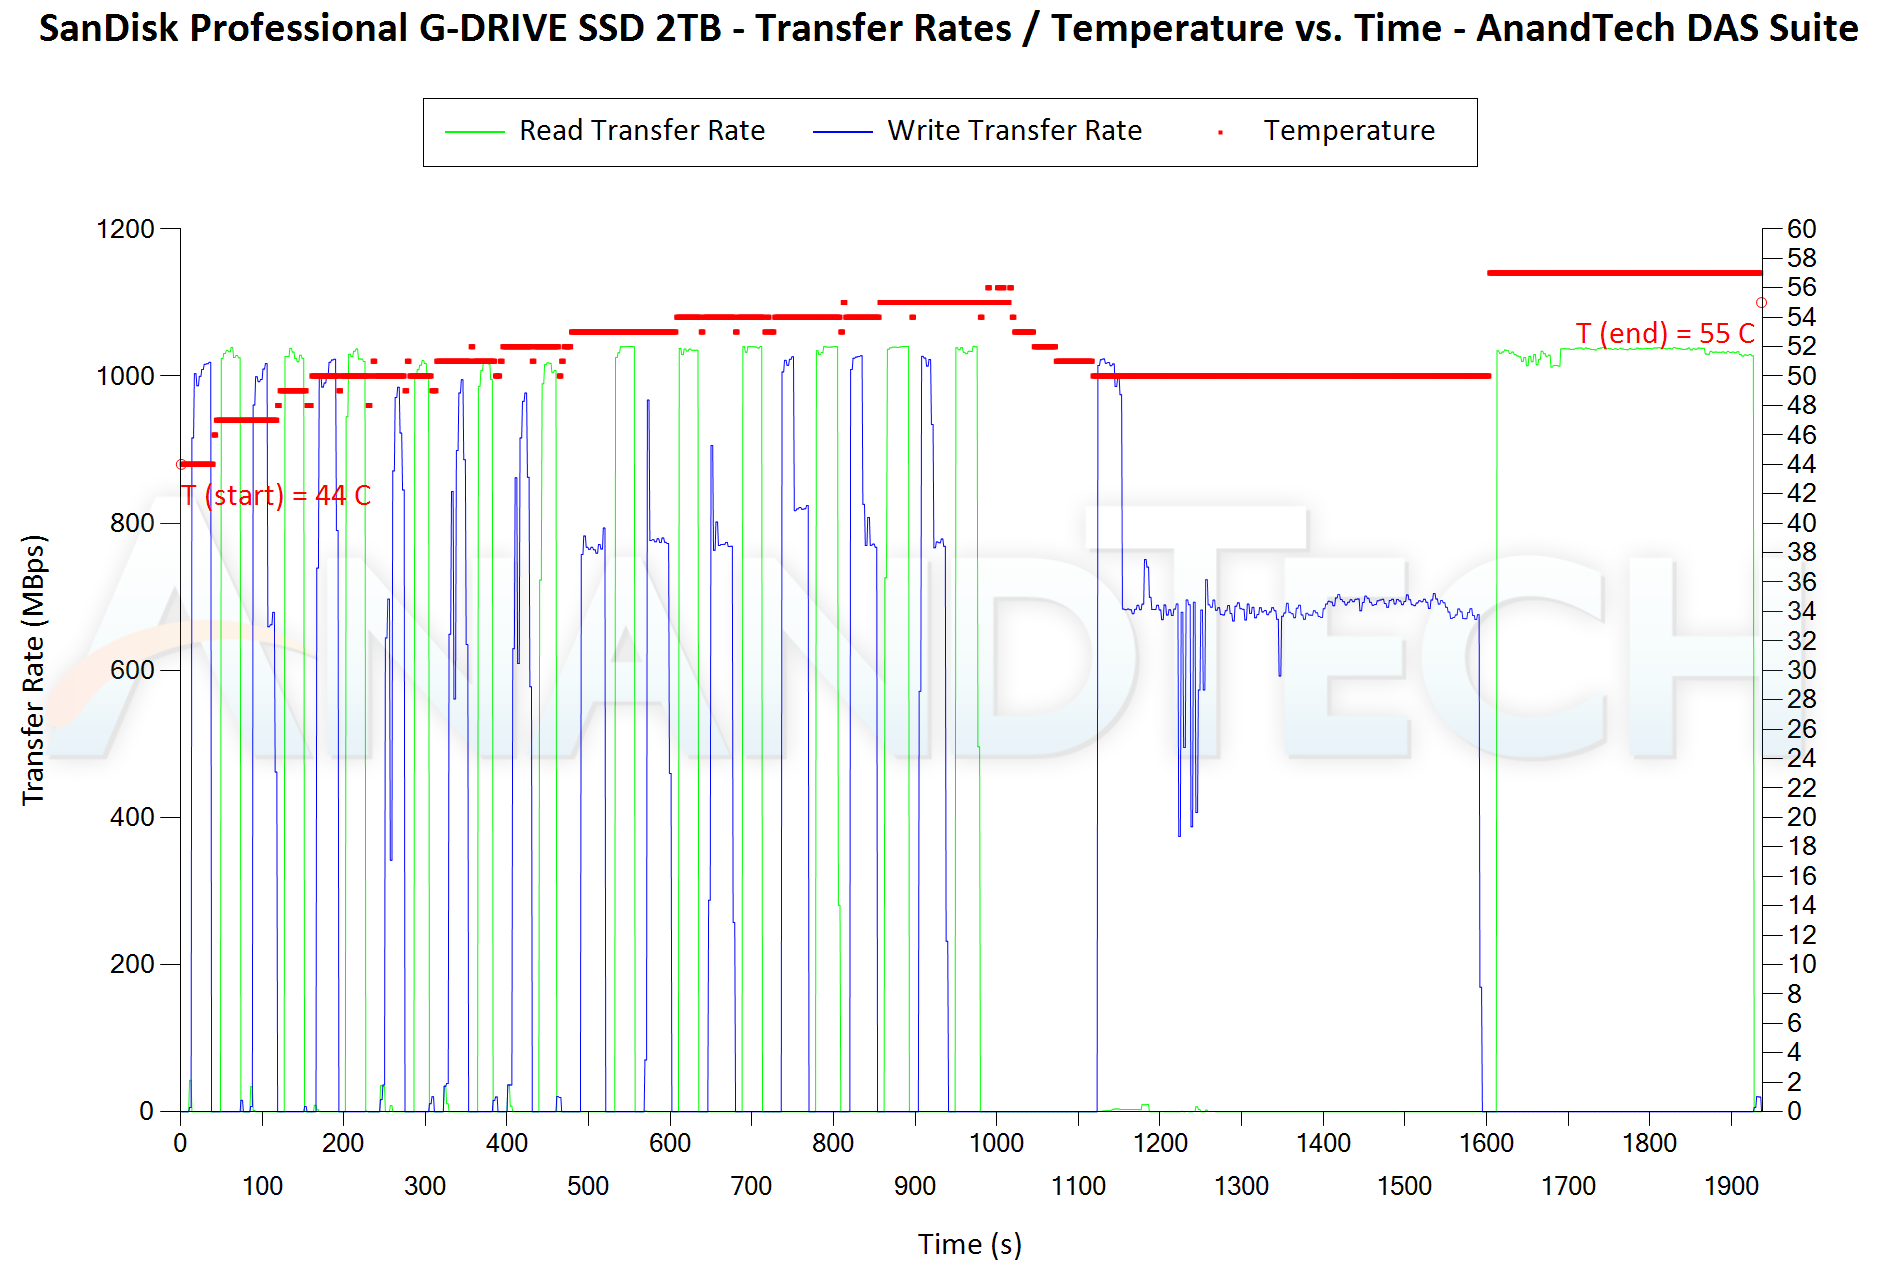
The first three sets of writes and reads correspond to the AV suite. A small gap (for the transfer of the video suite from the internal SSD to the RAM drive) is followed by three sets for the Home suite. Another small RAM-drive transfer gap is followed by three sets for the Blu-ray folder. This is followed up with the large-sized ISO files set. Finally, we have the single disk-to-disk transfer set.
While reads manage to maintain 1 GBps all through, the writes range from 700 MBps - 950 MBps. This variation appears to be due to high queue depth transfers coupled with an effect of a mixture of file sizes. Bridge-based PSSDs don't seem to suffer from such problems, though they do have an issue with the SLC cache running out. The direct-to-TLC write speeds of the Micron 176L 3D TLC are more than enough to keep the 1 GBps interface saturated. Thermal throttling doesn't appear to be an issue, with the maximum recorded temperature in the process being only 53 C.
PCMark 10 Storage Bench - Real-World Access Traces
There are a number of storage benchmarks that can subject a device to artificial access traces by varying the mix of reads and writes, the access block sizes, and the queue depth / number of outstanding data requests. We saw results from two popular ones - ATTO, and CrystalDiskMark - in a previous section. More serious benchmarks, however, actually replicate access traces from real-world workloads to determine the suitability of a particular device for a particular workload. Real-world access traces may be used for simulating the behavior of computing activities that are limited by storage performance. Examples include booting an operating system or loading a particular game from the disk.
PCMark 10's storage bench (introduced in v2.1.2153) includes four storage benchmarks that use relevant real-world traces from popular applications and common tasks to fully test the performance of the latest modern drives:
- The Full System Drive Benchmark uses a wide-ranging set of real-world traces from popular applications and common tasks to fully test the performance of the fastest modern drives. It involves a total of 204 GB of write traffic.
- The Quick System Drive Benchmark is a shorter test with a smaller set of less demanding real-world traces. It subjects the device to 23 GB of writes.
- The Data Drive Benchmark is designed to test drives that are used for storing files rather than applications. These typically include NAS drives, USB sticks, memory cards, and other external storage devices. The device is subjected to 15 GB of writes.
- The Drive Performance Consistency Test is a long-running and extremely demanding test with a heavy, continuous load for expert users. In-depth reporting shows how the performance of the drive varies under different conditions. This writes more than 23 TB of data to the drive.
Despite the data drive benchmark appearing most suitable for testing direct-attached storage, we opt to run the full system drive benchmark as part of our evaluation flow. Many of us use portable flash drives as boot drives and storage for Steam games. These types of use-cases are addressed only in the full system drive benchmark.
The Full System Drive Benchmark comprises of 23 different traces. For the purpose of presenting results, we classify them under five different categories:
- Boot: Replay of storage access trace recorded while booting Windows 10
- Creative: Replay of storage access traces recorded during the start up and usage of Adobe applications such as Acrobat, After Effects, Illustrator, Premiere Pro, Lightroom, and Photoshop.
- Office: Replay of storage access traces recorded during the usage of Microsoft Office applications such as Excel and Powerpoint.
- Gaming: Replay of storage access traces recorded during the start up of games such as Battlefield V, Call of Duty Black Ops 4, and Overwatch.
- File Transfers: Replay of storage access traces (Write-Only, Read-Write, and Read-Only) recorded during the transfer of data such as ISOs and photographs.
PCMark 10 also generates an overall score, bandwidth, and average latency number for quick comparison of different drives. The sub-sections in the rest of the page reference the access traces specified in the PCMark 10 Technical Guide.
Booting Windows 10
The read-write bandwidth recorded for each drive in the boo access trace is presented below.
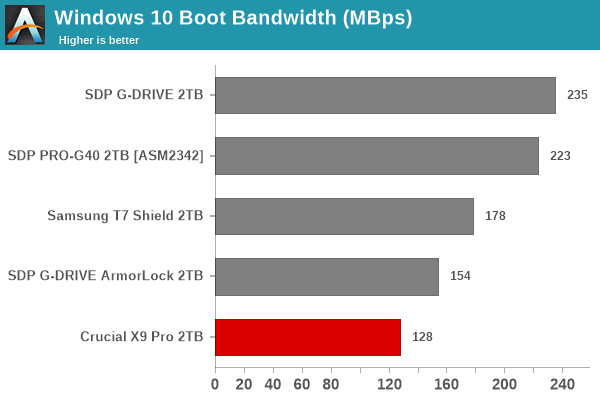
Low queue depth random accesses usually get better performance with DRAM-equipped SSDs using dedicated high-performance NVMe SSD controllers. So, it is not a surprise that the SM2320-equipped Crucial X9 Pro can only deliver passable performance as a boot drive.
Creative Workloads
The read-write bandwidth recorded for each drive in the sacr, saft, sill, spre, slig, sps, aft, exc, ill, ind, psh, and psl access traces are presented below.
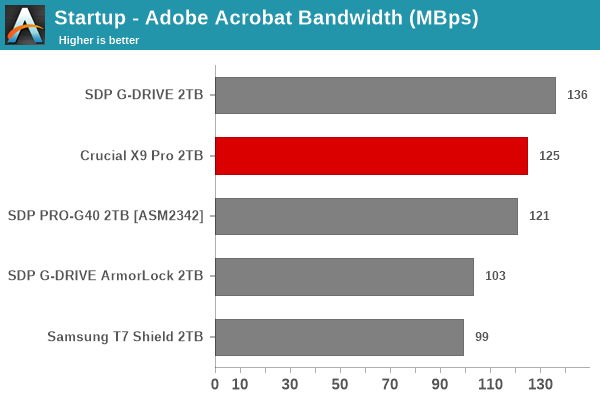
The Crucial X9 Pro delivers much better performance for creative workloads, landing in middle of the pack for most traces and emerging as a credible competitor to bridge-based high-performance PSSDs.
Office Workloads
The read-write bandwidth recorded for each drive in the exc and pow access traces are presented below.
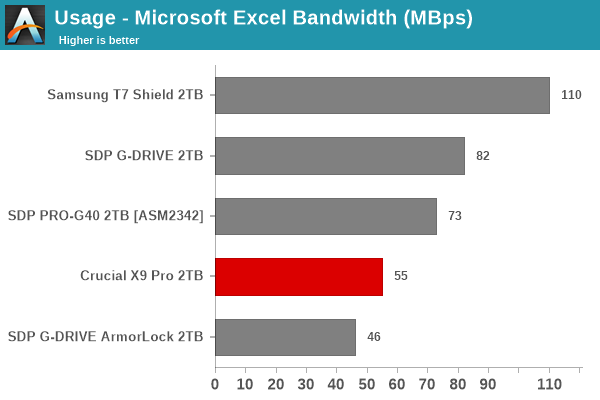
The SanDisk PSSDs deliver great performance for both office workloads, and the Crucial X9 Pro finds itself in the middle of the pack again.
Gaming Workloads
The read-write bandwidth recorded for each drive in the bf, cod, and ow access traces are presented below.
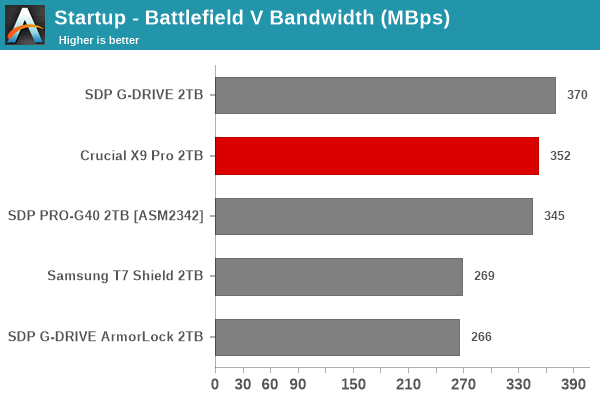
Gaming workloads are read-intensive, and most loads are for large files. In that context, the Crucial X9 Pro can deliver very good performance. However, the drive is surpassed slightly in performance by the SanDisk PSSDs, but the absolute numbers are still very good.
Files Transfer Workloads
The read-write bandwidth recorded for each drive in the cp1, cp2, cp3, cps1, cps2, and cps3 access traces are presented below.
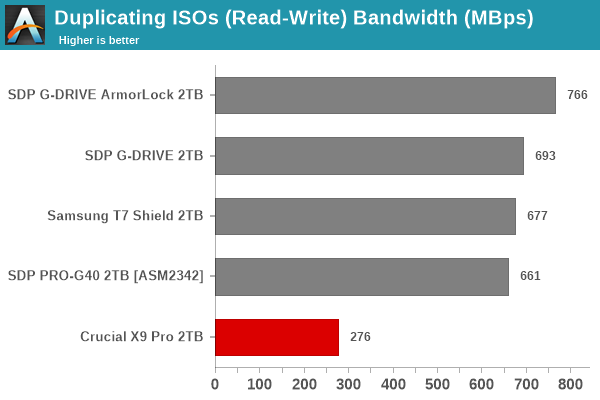
The Crucial X9 Pro performs very well for large-sized sequential transfers. However, having a mixture of reads and writes (possible in the duplicating workloads) with large file sizes brings down the performance by a significant amount compared to other PSSDs. This effect is not evident as much with small-sized files.
Overall Scores
PCMark 10 reports an overall score based on the observed bandwidth and access times for the full workload set. The score, bandwidth, and average access latency for each of the drives are presented below.
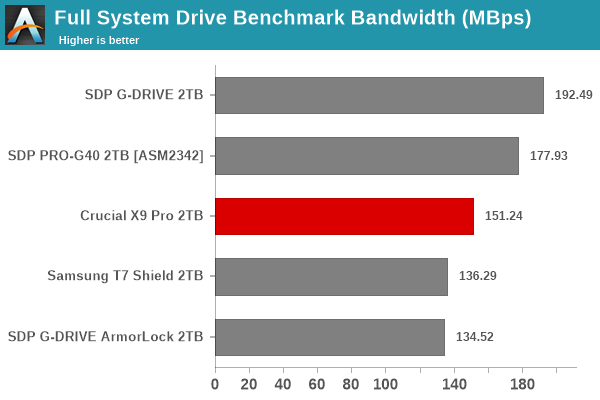
The overall scores see the Crucial X9 Pro in the middle of the pack and that is a creditable result, given that all the other PSSDs are bridge-based high-performance ones.


18 Comments
View All Comments
ceisserer - Friday, August 18, 2023 - link
Too bad those devices are soo clumsy - that SM2320 together with one NAND chip in a tiny package would result in an excellent small portable OS drive. Of course there would be thermal throttling, however that plastic case that crucial drive is shipped with doesn't seem to do a lot for thermals either...ganeshts - Friday, August 18, 2023 - link
The casing of the X9 Pro is anodized aluminum. Thermals are great (refer graphs in the final section). Can't expect anything better for this performance class given the constraints of the SM2320 (DRAM-less / native UFD)meacupla - Friday, August 18, 2023 - link
62c after an extended run is pretty good.If it's hitting 80c, then I would start to worry.
dqniel - Friday, August 18, 2023 - link
Are we reading the same review? The thermals look good. Performance doesn't seem to degrade in their extended tests.nfriedly - Friday, August 18, 2023 - link
I recently got a Transcend ESD310 and I friggin love it.It gets a little warm, and it's not the fastest *SSD*, but it looks like a regular little USB flash drive, and it's performance blows away anything else that's a comparable size.
Also, it has a USB-A connector on one end and a USB-C connector on the other, so I can plug it into basically any computer (or recent Android device).
MiltzMan - Monday, August 21, 2023 - link
On a MacBook Pro 16 inch M1Pro this drive performs exactly like the X8. The sustained writes are about 300mb/s which is awful. The drive only performs well in benchmarks and it’s an upgrade to the X8. I’m extremely disappointed.ganeshts - Monday, August 21, 2023 - link
It performs great in regular usage. Most of our 'benchmarks' are real-world use-cases dealing with regular file transfers.What file system is your X9 Pro formatted in? We tested with exFAT, and it should perform similarly in all OSes.
You should report your findings to Crucial support. Sustained write of 300 MBps for sequential workloads (large-sized file transfers) is not expected from the X9 Pro. Of course, if you are transferring lots of small-sized files (say 4KB to 64KB in size), then all bets are off.
MiltzMan - Monday, August 21, 2023 - link
I’m using the 4TB version formatted to APFS. I’m transferring folders with lots of raw camera files. Files range from 20 to 60MB in size and the folders are up to 350GB. I also find it odd that the Crucial software doesn’t support the X9 Pro drive yet. You think my drive is defective? If so I will return it.ganeshts - Tuesday, August 22, 2023 - link
20 - 60 MB is pretty large. You should be getting 600 MBps+ for those types of file sizes. I would say that you need to take it up with Crucial support and follow their advice on the return. I assume they will ask you to do some additional tests before branding the drive as defective. Since I don't have any experience with Apple systems, I am not sure where exactly the bottleneck is creeping in, but the support team probably will have more inputs.Luke Ottrey - Wednesday, August 23, 2023 - link
Hi MiltzMan and Ganesh - Luke from Crucial/Micron here.I run a Macbook Air M1 myself; and while I am not in a position to really make authoritative comments on how Apple resources their USB/Thunderbolt ports; I can confirm that I personally have seen on my machine some less-than-USB-bus speeds on my M1 Air. Unfortunately I don't have a large enough internal SSD to do a similar comparison to your workload of 350GB large files; but just now I copied three folders each with 10GB of various linux distribution downloads, PSD's, zip files etc and achieved around 32.6GB transferred in 44 seconds; around 740MB/s on an APFS formatted X9 Pro.
300MB/s is abnormal; but as Ganesh alludes to, small files and filesystem overheads often become a large part. Please forgive the question; but are you sure there are no small files (hidden files, etc) that are being copied across that could be contributing to filesystem overhead?