The Samsung 870 EVO (1TB & 4TB) Review: Does the World Need Premium SATA SSDs?
by Billy Tallis on February 17, 2021 8:00 AM ESTAnandTech Storage Bench - The Destroyer
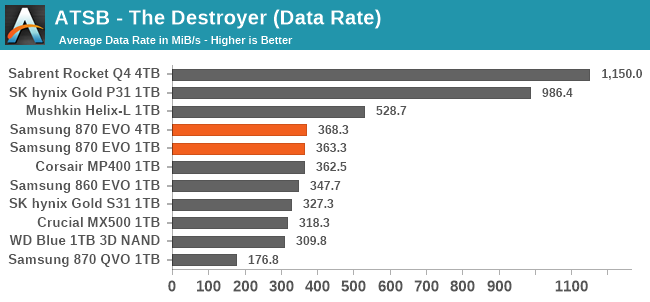
Our AnandTech Storage Bench tests are traces (recordings) of real-world IO patterns that are replayed onto the drives under test. The Destroyer is the longest and most difficult phase of our consumer SSD test suite. For more details, please see the overview of our 2021 Consumer SSD Benchmark Suite.
 |
|||||||||
| Average Data Rate | |||||||||
| Average Latency | Average Read Latency | Average Write Latency | |||||||
| 99th Percentile Latency | 99th Percentile Read Latency | 99th Percentile Write Latency | |||||||
| Energy Usage | |||||||||
For SATA drives, the Samsung 870 EVOs turn in class-leading scores on almost all of the performance metrics. But these improvements are all marginal at best; the SATA interface bottleneck almost completely levels the playing field. The small improvements to read latency brought by the 870 EVO pale in comparison to what is achieved by even entry-level NVMe SSDs.
In stark contrast to the performance numbers, the 870 EVOs turn out to be the most power-hungry TLC drives in this bunch: they sacrifice some of the efficiency improvements the 860 EVO provided, even though drives like the SK hynix Gold S31 have been able to deliver significant improvement on this.
AnandTech Storage Bench - Heavy
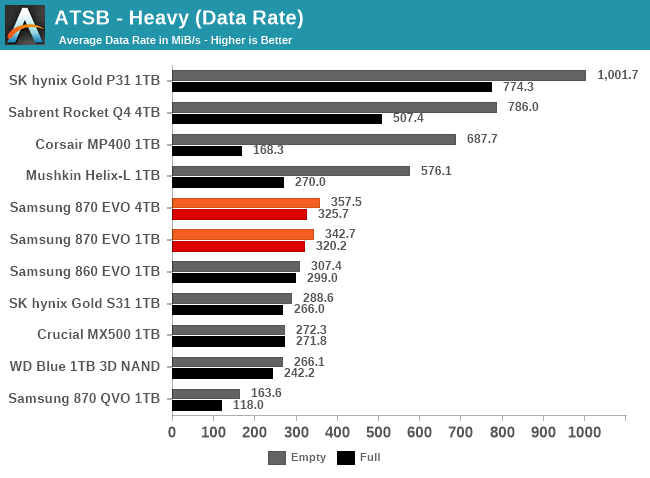
The ATSB Heavy test is much shorter overall than The Destroyer, but is still fairly write-intensive. We run this test twice: first on a mostly-empty drive, and again on a completely full drive to show the worst-case performance.
 |
|||||||||
| Average Data Rate | |||||||||
| Average Latency | Average Read Latency | Average Write Latency | |||||||
| 99th Percentile Latency | 99th Percentile Read Latency | 99th Percentile Write Latency | |||||||
| Energy Usage | |||||||||
The scores for the Heavy test paint much the same picture as for The Destroyer. The full-drive test runs additionally show that the worst-case performance of the mainstream SATA SSDs is still superior to many entry-level NVMe SSDs, even though the NVMe SSDs significantly outperform SATA for any more normal workload.
AnandTech Storage Bench - Light
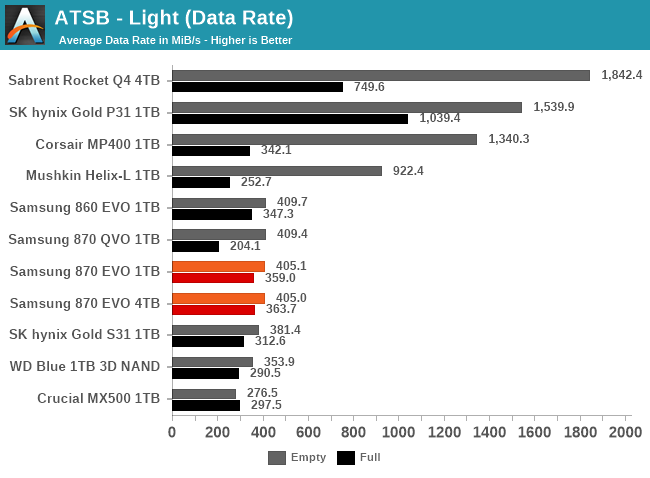
The ATSB Light test represents ordinary everyday usage that doesn't put much strain on a SSD. Low queue depths, short bursts of IO and a short overall test duration mean this should be easy for any SSD. But running it a second time on a full drive shows how even storage-light workloads can be affected by SSD performance degradation.
 |
|||||||||
| Average Data Rate | |||||||||
| Average Latency | Average Read Latency | Average Write Latency | |||||||
| 99th Percentile Latency | 99th Percentile Read Latency | 99th Percentile Write Latency | |||||||
| Energy Usage | |||||||||
On the Light test, the measurable but imperceptible performance advantages of the 870 EVOs over other SATA drives have basically disappeared. The read latency scores on the full-drive test runs may be a tiny bit better than the 860 EVO, but the only scores that have clearly shifted with this new generation are the energy consumption figures that have creeped up.
PCMark 10 Storage Benchmarks
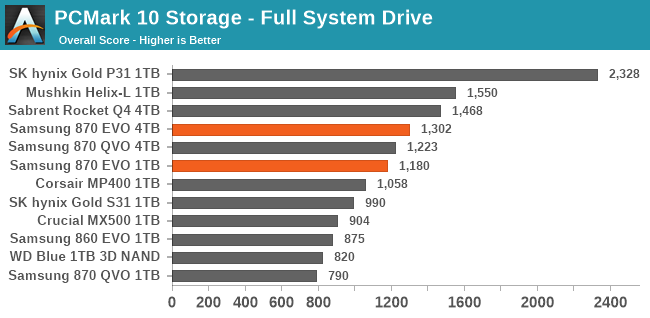
The PCMark 10 Storage benchmarks are IO trace based tests similar to our own ATSB tests. For more details, please see the overview of our 2021 Consumer SSD Benchmark Suite.
 |
|||||||||
| Full System Drive | Overall Score | Average Bandwidth | Average Latency | ||||||
| Quick System Drive | Overall Score | Average Bandwidth | Average Latency | ||||||
| Data Drive | Overall Score | Average Bandwidth | Average Latency | ||||||
The Full System Drive test from the PCMark 10 Storage suite shows a much wider spread of performance scores among SATA drives than our ATSB traces, but also a much smaller advantage for the NVMe drives. Judging by this test, the 870 EVO offers a small but real improvement to performance compared to earlier SATA drives. The 4TB 870 QVO also scores quite well since it benefits from the same controller and has enough SLC cache to almost match the performance of the 4TB 870 EVO.
The subset of tests included in the Quick System Drive and Data Drive benchmarks show a more level playing field among SATA SSDs, and a greater advantage for NVMe drives. Since we run these tests before the Full System Drive test, each drive is closer to its fresh out-of-the-box state, which helps these tests get closer to showing the theoretical peak performance of a drive.


136 Comments
View All Comments
Krimzon - Wednesday, February 17, 2021 - link
Early USB standards were uni directional. 3 and 4 are full duplex.PixyMisa - Thursday, February 18, 2021 - link
10Gbps USB is already twice as fast as 6Gbps SATA because it uses more efficient encoding. 20Gbps USB is available right now, and 40Gbps is part of the USB 4 spec though I don't know how widespread support for it is.Wereweeb - Wednesday, February 17, 2021 - link
No need to replace SATA, it will die by itself. What we need is high-end consumer motherboards to get U.3.Billy Tallis - Wednesday, February 17, 2021 - link
U.3 is probably only going to be around for two or three product cycles. It's very much a stopgap solution to unify U.2 and SAS, both of which are already on the way out in favor of EDSFF.Wereweeb - Thursday, February 18, 2021 - link
Great! Then they can introduce it for consumers to have 2.5" drives again.Leeea - Wednesday, February 17, 2021 - link
The nice thing about SATA SSDs is they tend to just work. Pull one out of one system, stick them in another, and it can boot.The pci drives seem to be a lot more fussy with that.
danbob999 - Wednesday, February 17, 2021 - link
Not really. All drives (IDE / SATA / NVMe / USB / Whatever) pretty much just work. The problem is the OS may not boot. When switching to a different protocol (say SATA to NVMe), you increase chances it won't boot.Linux is easier to get to boot than Windows when changing the drive to a different system.
Jorgp2 - Wednesday, February 17, 2021 - link
Nah, it all comes down to EFI vs MBR.MBR systems just look for a boot partition and boot it, EFI actually stores the location on the motherboard flash.
WaltC - Wednesday, February 17, 2021 - link
Agreed...;) I might say "UEFI vs. Legacy," though. And much of it has to do with the knowledge, experience, and skill of the computer operator...! No question about that. (It's actually MBR vs. GPT--GPT is better. All of my SATA HDDs are formatted GPT, etc. I have no MBR-formatted drives.)The list of NVMe drives here is curious. Where is the 980 Pro from Samsung?--been selling for a while now--one of several PCIe4 NVMe drives available. Makes me question when this article was actually written....? It seems incomplete or out of date. Samsung is a chip company no longer in the business of making platter drives (last I looked, anyway-do they still sell the Spinpoints?), so it's natural for them to sell SSDs of varying types, sizes, and prices, imo.
Billy Tallis - Wednesday, February 17, 2021 - link
I deliberately chose not to include 980 PRO results in the graphs for this review, because that's a silly comparison to make against a SATA drive. But if you really care, you can use Bench: https://www.anandtech.com/bench/product/2724?vs=27...